

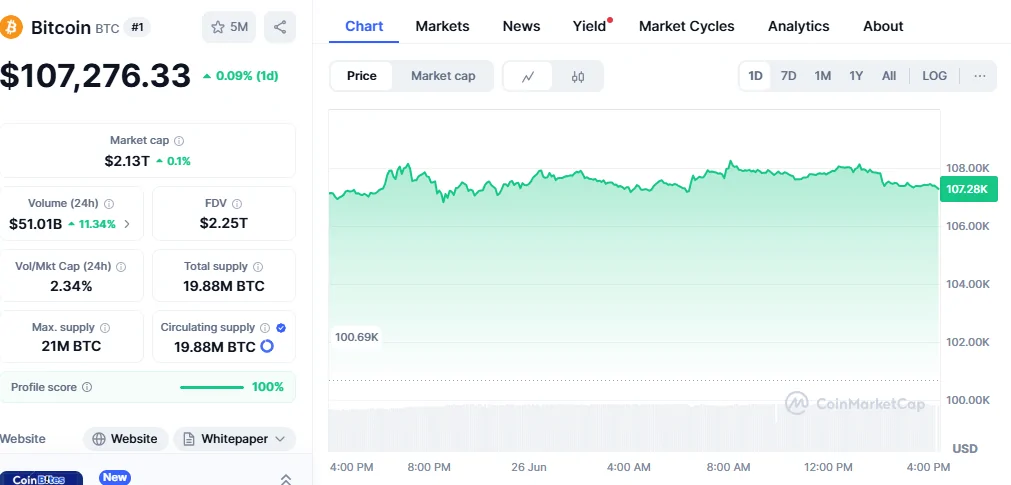
Bitcoin (BTC) is demonstrating compelling signs of a bullish reversal on its daily chart, currently trading at $107,05, with a market capitalisation of $2.12 trillion and a 24-hour trade volume of $27.75 billion. Technical indicators are aligning to suggest a potential shift in upward momentum, making this a critical juncture for traders and investors monitoring the digital asset’s price action.
Current Market Overview: Bitcoin’s Position in June 2025
Price Action and Volume Analysis
The digital asset has seen an intraday range between $105,030 and $107,219, indicating modest volatility amid signs of recovery across multiple timeframes. This relatively tight trading range suggests consolidation before a potential directional move.
The current price level represents a crucial testing ground for Bitcoin’s near-term trajectory. With institutional interest remaining robust and retail sentiment gradually improving, the stage appears set for a significant price movement in either direction.
Market Capitalisation Milestone
Bitcoin’s market capitalisation crossing the $2.12 trillion threshold marks a significant psychological level. This valuation positions Bitcoin ahead of many major corporations and sovereign wealth funds, reinforcing its status as a legitimate asset class within the global financial ecosystem.
Technical Analysis: Bullish Reversal Signals Emerge
Key Support and Resistance Levels
Technical analysis reveals several critical price levels that traders are closely monitoring:
Immediate Resistance Levels:
- $109,465 – a previously tested level that needs to break for further gains
- $110,800 – if BTC closes above $109,465 with substantial volume
Critical Support Zones:
- $101,400 is essential to keep the bullish structure intact
- Secondary support 105,000 based on recent consolidation patterns
Moving Average Convergence: Golden Cross Formation
One of the most significant developments in Bitcoin’s technical landscape is the potential formation of a golden cross pattern. The 50-day SMA has begun to rise again and could soon cross above the 200-day SMA, setting up a bullish golden cross in the coming weeks.
This pattern holds particular significance given historical precedent. This pattern closely mirrors last year’s trend: the death cross in August marked a bottom, quickly followed by a golden cross that sparked a breakout above $70,000 and ultimately led to a rally above $109,000 to new highs.
MACD and RSI Indicators
The Moving Average Convergence Divergence (MACD) and Relative Strength Index (RSI) are providing mixed but increasingly optimistic signals:
MACD Analysis: The MACD line (-384.51) is still below the signal line, indicating a lingering bearish bias. However, bearish momentum appears to be weakening, suggesting a potential reversal in the making.
RSI Considerations: Current RSI readings indicate Bitcoin is neither in overbought nor oversold territory, providing room for upward movement without immediate selling pressure from technical levels.
Bollinger Bands Analysis: Room for Expansion
The price is still below the upper band ($109,730), indicating there’s room for bullish expansion if momentum builds. The lower band support lies near $101,975. This configuration suggests that Bitcoin has space to move higher without immediately triggering overbought conditions.
The narrowing of Bollinger Bands often precedes significant price movements, and current band positioning indicates potential for substantial volatility in the coming weeks.
Price Predictions and Expert Forecasts
Short-Term Outlook (July 2025)
If Bitcoin breaks above key resistance levels at $111,500 and $112,000, BTC price may potentially climb toward $113,500 by early July 2025. This represents approximately a 6% upside from current levels, making it an achievable target if bullish momentum sustains.
Medium-Term Projections (2025-2026)
Expert predictions for Bitcoin’s trajectory through 2025 and beyond vary significantly:
Conservative Estimates:
- BTC clears $110,000 in 2025, and reaches $74,000 by 2026
Optimistic Scenarios:
- If things turn bullish, BTC is expected to create a high of $175K
- Digital Coin Price suggests an average price of $210,644.67 for 2025, with peaks potentially reaching $230,617.59
Long-Term Vision: Bitcoin is expected to reach and surpass $200,000 at some point before 2030, according to institutional forecasts.
Market Catalysts Driving Bullish Sentiment

Institutional Adoption Continues
The sustained institutional interest in Bitcoin as a treasury asset and investment vehicle continues to provide fundamental support for prices. Major corporations and financial institutions are increasingly viewing Bitcoin as a hedge against traditional market volatility.
Regulatory Clarity Improvements
Enhanced regulatory frameworks in major jurisdictions are reducing uncertainty and encouraging broader adoption. This regulatory maturation is creating a more stable environment for institutional and retail participation.
Network Fundamentals
Bitcoin’s network remains robust with strong hash rates and continued development activity. These fundamental strengths provide a solid foundation for long-term value appreciation.
Risk Factors and Potential Downside Scenarios
Bearish Alternative
If things go south, we can expect a low of $70K according to some analysts. This represents a significant downside risk that investors must consider when positioning for potential upside.
Technical Breakdown Levels
Should Bitcoin fail to hold above $101,400, it could signal a breakdown of the current bullish structure, potentially leading to deeper corrections.
Market Volatility Concerns
Cryptocurrency markets remain inherently volatile, and external factors such as macroeconomic conditions, regulatory changes, or major market events could quickly alter the current bullish narrative.
Trading Strategies for the Current Environment
For Short-Term Traders
- Breakout Strategy: Monitor the $109,465 resistance level for confirmed breakouts with volume
- Support Defense: Use $105,000-$101,400 zone as stop-loss levels
- Volume Confirmation: Ensure any directional moves are accompanied by above-average trading volume
For Long-Term Investors
- Dollar-Cost Averaging: Consider gradual accumulation during consolidation phases
- Position Sizing: Maintain appropriate risk management relative to portfolio size
- Fundamental Focus: Stay updated on adoption trends and network developments
What to Watch: Key Levels and Timeframes
Critical Price Levels
- Immediate ResiResistance07,500-$109,500 range
- Breakout Target: $111,500-$113,500 zonSupport 0-$105,000pport0-$105,000 area
Technical Milestones
- Golden cross formation on daily charts
- MACD line crossing above the signal line
- RSI breaking above 60 on sustained volume
Timeframe Considerations
The following 2-4 weeks will be crucial for determining whether the current bullish reversal signals translate into sustained upward momentum or represent another false breakout attempt.
Conclusion
Bitcoin’s daily chart is painting an increasingly optimistic picture, with multiple technical indicators aligning to support a bullish reversal thesis. The currency has marginally broken through resistance points. An established break predicts a further rise. The currency is assessed as technically positive for the long term.
While risks remain and the cryptocurrency market’s inherent volatility demands careful risk management, the current technical setup suggests higher probability outcomes favor the bulls. Traders and investors should monitor key resistance levels around $109,465 and $111,500 for confirmation of the bullish reversal narrative.