


LTC/USDT Price Analysis: The Litecoin to Tether trading pair, LTCUSDT, has been through a lot recently. The cryptocurrency encountered a formidable obstacle in its attempt to achieve its previous high of $413 despite displaying outstanding performance with an astounding 750% return from January 2020 to April 2021.
This resulted in a bearish trend that lasted over 14 months. Having recovered about 150% from its low point, LTC has demonstrated upward momentum since mid-July 2022. Here, we’ll examine the present price movement, spot an ascending triangular pattern, and discuss what it could mean for investors and traders.
Impressive Performance and Key Levels
The price of LTCUSDT has been steadily rising over the past year, and it is currently trading at roughly $91.99. The cryptocurrency has done well historically but is struggling to break through the $413 level.
Essential levels to keep an eye on are $149.84 and $326.83, which have the potential to serve as solid levels of support or resistance, respectively. Also, at $45, there is a noticeable weekly demand zone, meaning buyers may be interested.
Current Price Action
LTCUSDT constructed an ascending triangle pattern within the weekly time frame from April 18, 2022, to July 17, 2023, and it is possible that this pattern will reverse.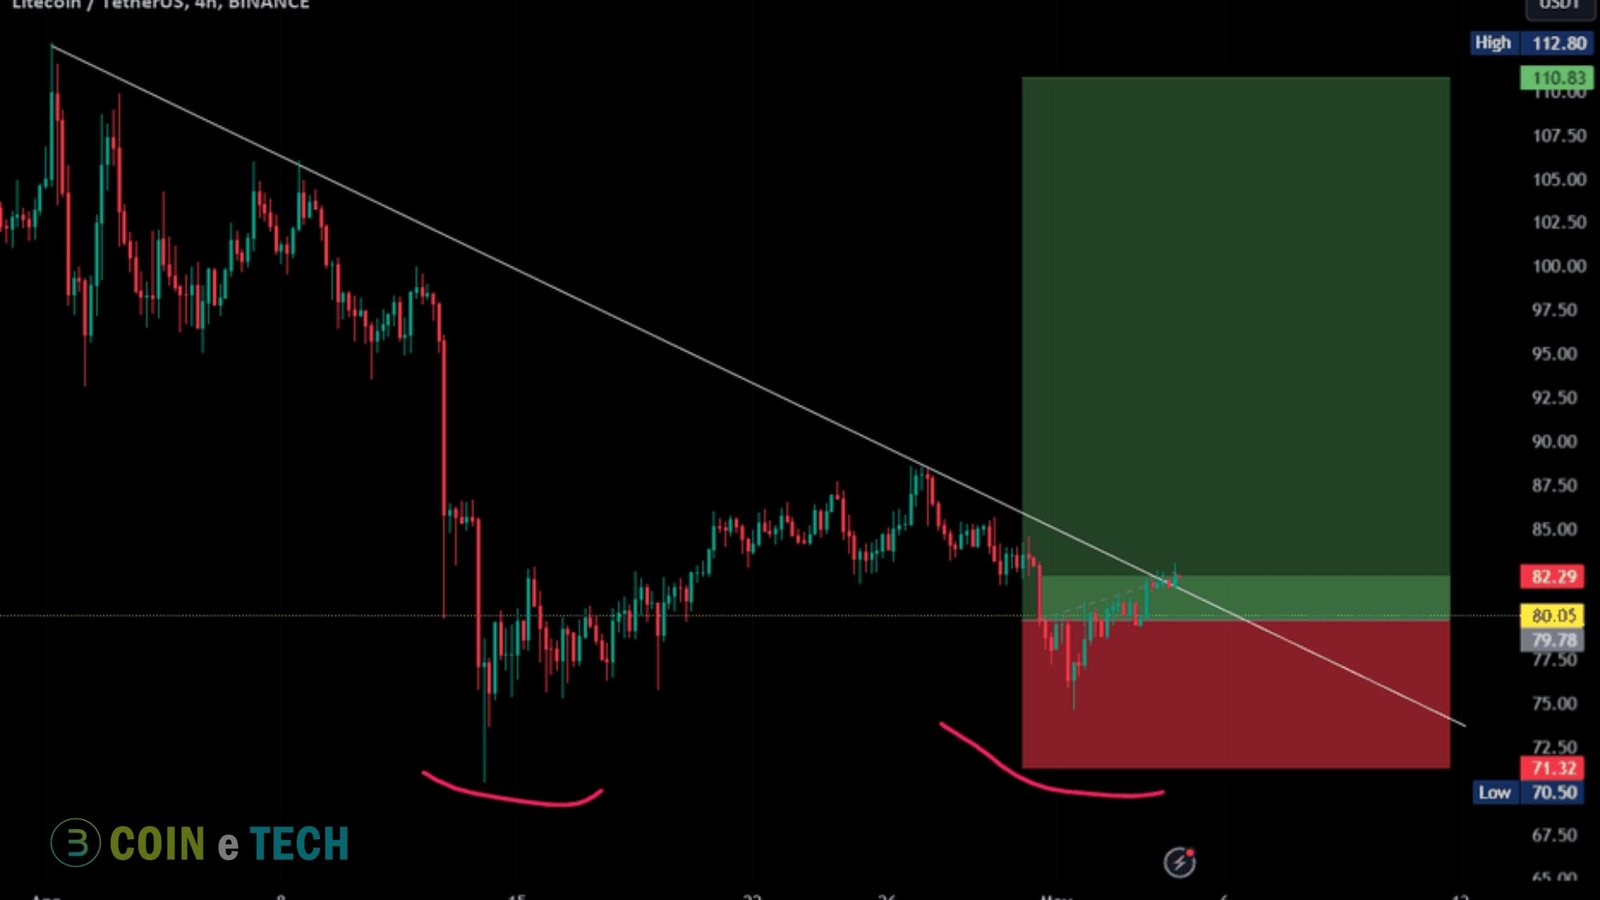
LTC/USDT Price Analysis: This pattern and the recent volume surge may indicate a trend change and higher volatility. This development warrants traders’ attention, as it may signal the departure of weak purchasers and the beginning of a new positive trend.
Projected Targets and Breakout Potential
The ascending triangle pattern’s range structure allows one to identify a measured move. With a successful breakout above the $110.80 resistance level, LTCUSDT could potentially hit $190 as its first target and $330 as its second target. If the breakout holds and the bullish momentum persists, these levels could serve as price milestones.
Caution is necessary despite the ascending triangle pattern suggesting a possible breakout and bullish situation. LTCUSDT’s breakdown of the $75 support level would trigger a negative situation. This has the potential to shift the market’s sentiment, rendering the bullish outlook pointless. Investors and traders need to monitor price action closely and adapt their plans accordingly.
The LTCUSDT trading pair has demonstrated remarkable performance after reversing a downward trend and showing signs of positive momentum since mid-July 2022. If an ascending triangle pattern forms, a possible trend reversal and breakout could occur.
To drive LTCUSDT towards higher price objectives, traders must watch for a breach above the resistance level of around $110.80. But be wary, as a decline below the $75 support level would signal a negative situation. Investors and traders in the LTCUSDT market need to be alert and flexible.